In the world of modern infrastructure operations, observability is only as good as the actions it drives. Integrating VMware Cloud Foundation (VCF) Operations (formerly Aria Operations) with ITSM platforms like ServiceNow is a critical step for many of my clients. It transforms passive monitoring into active incident management.
However, as with any integration involving webhooks and external APIs, things don’t always go according to plan.
Recently, while implementing a ServiceNow integration following standard deployment guides (kudos to Brock Peterson for his excellent documentation on ServiceNow Management Packs and Webhooks), I hit a roadblock. My instance was failing to send notifications, and the standard UI errors were vague.
If you find yourself in a similar situation where the default log bundles aren’t providing enough fidelity, you need to peel back the layers of the Analytics service. Here is how to enable advanced debugging to pinpoint exactly where your notification plugins are failing.
The Challenge: Insufficient Verbosity
When a notification plugin fails, the first instinct is to generate a full log bundle. Unfortunately, for lightweight failures like webhook handshakes or payload formatting errors, the standard logs often remain silent or generic. To see the actual HTTP transactions and internal logic, we need to manually increase the logging level for the specific Java class responsible for outgoing webhooks.
The Solution: Enabling Debug Logging for WebhookSender
To get the visibility we need, we must modify the runtime logging configuration of the Analytics service.
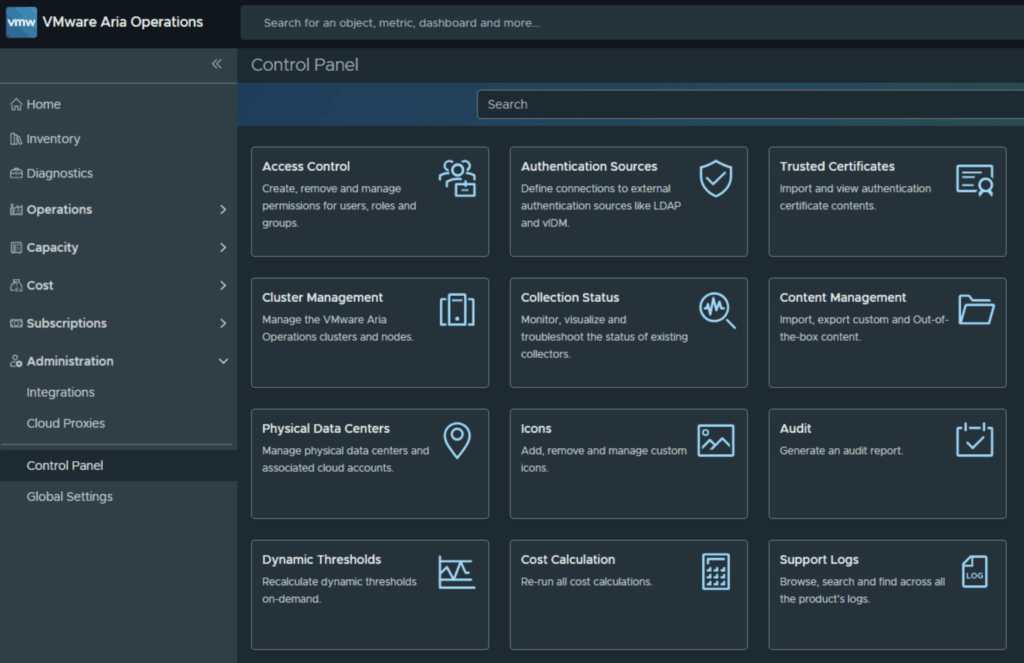
1. Access the Support Logs Control Panel Navigate to Administration > Control Panel > Support Logs. This is the command center for real-time log analysis and configuration.The Challenge: Insufficient Verbosity
When a notification plugin fails, the first instinct is to generate a full log bundle. Unfortunately, for lightweight failures like webhook handshakes or payload formatting errors, the standard logs often remain silent or generic. To see the actual HTTP transactions and internal logic, we need to manually increase the logging level for the specific Java class responsible for outgoing webhooks.
The Solution: Enabling Debug Logging for WebhookSender
To get the visibility we need, we must modify the runtime logging configuration of the Analytics service.
1. Access the Support Logs Control Panel Navigate to Administration > Control Panel > Support Logs. This is the command center for real-time log analysis and configuration.

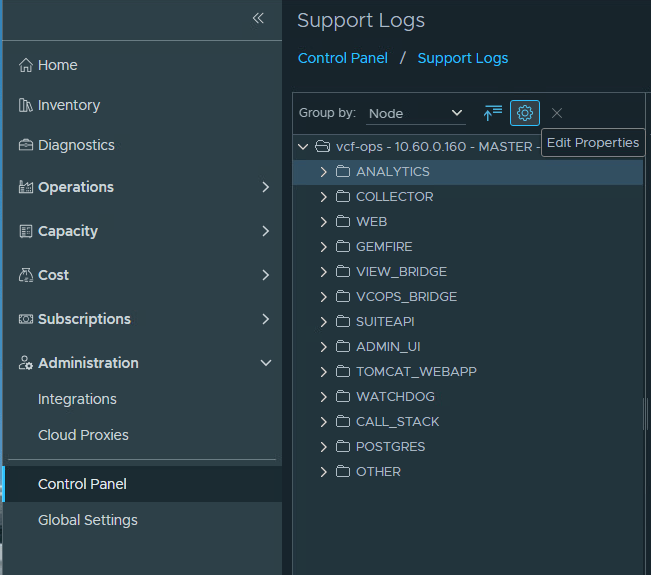
2. Configure the Analytics Service In the folder structure on the left, select the Analytics folder. Once selected, you will see a gear icon appear in the top right of the pane. Click it to edit the logging configuration.
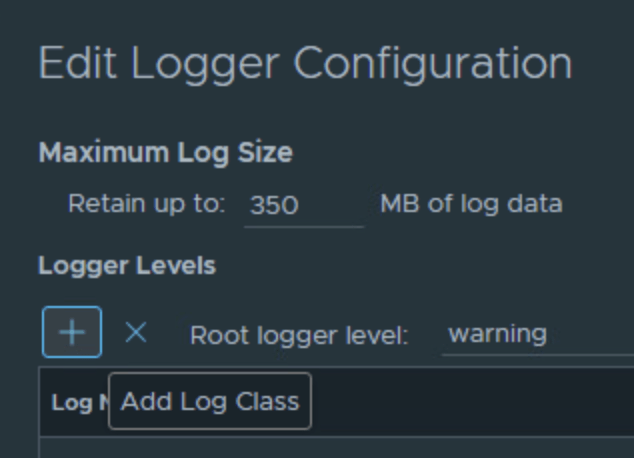
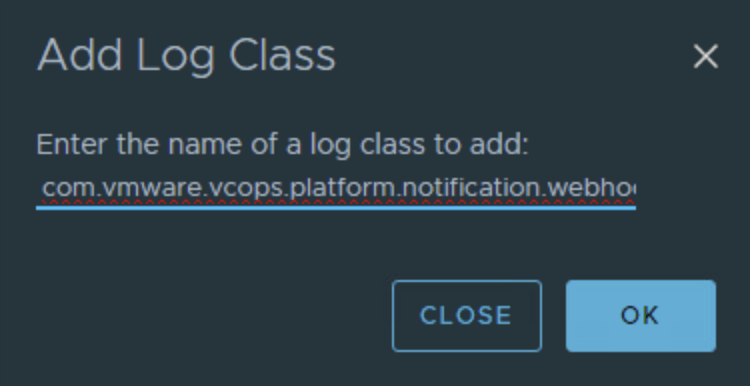
3. Add the WebhookSender Class We need to tell VCF Operations to explicitly track the webhook notification class. Click the Plus (+) sign to add a new logger class.
In the class name field, enter the following package path exactly: com.vmware.vcops.platform.notification.webhook.WebhookSender
4. Set the Logging Level Once the class is added, search for “webhook” in the list to verify it is present. Change the Logging Level from the default (usually INFO or ERROR) to DEBUG.
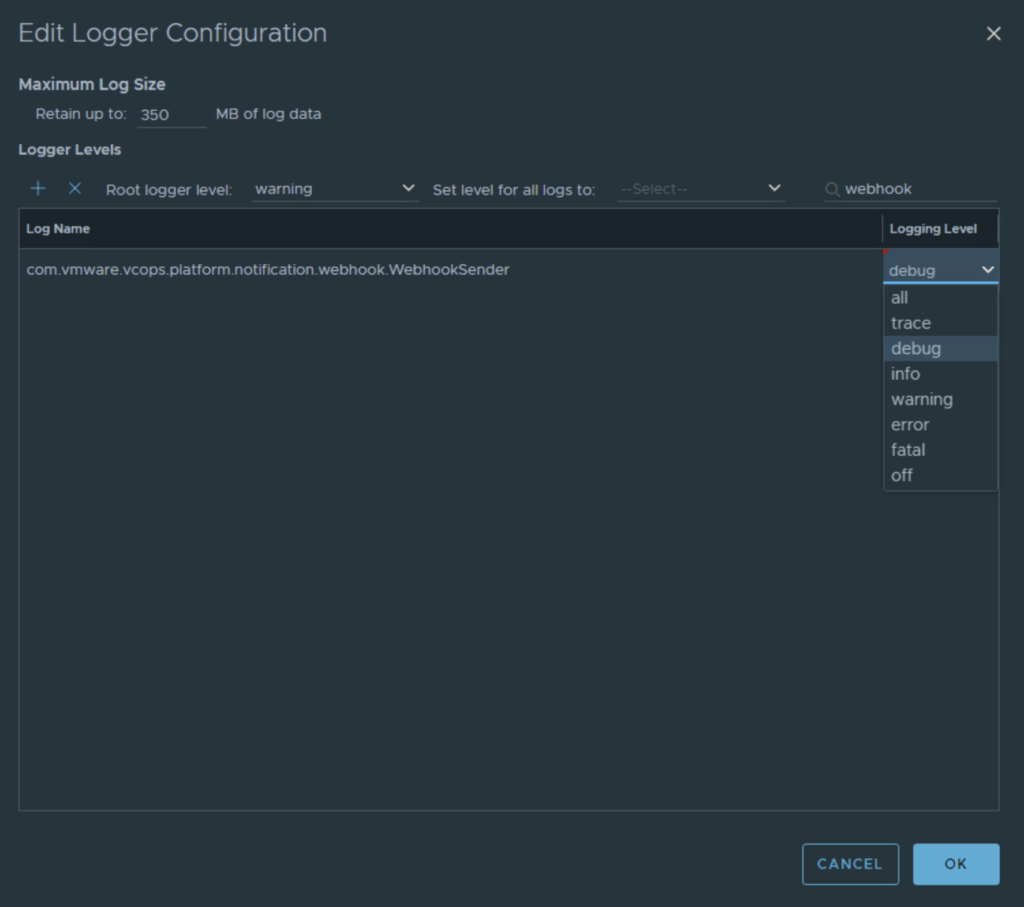
Click OK to save the configuration.
Analyzing the Data
With the new logging level active, replicate the issue by forcing a notification test or waiting for an alert to trigger.
Navigate back to the Analytics folder in the Support Logs view. You should now see a log file named analytics-xxx.log(where xxx is usually a number or timestamp).
Open this log and search for WebhookSender. You will now see detailed entries regarding the transmission attempts, including:
- Destination URLs
- HTTP response codes
- Payload structures
- Authentication failure details
This granular data usually highlights the root cause immediately—whether it’s a firewall drop, a malformed JSON payload, or an authentication mismatch with ServiceNow.
Important: Post-Mortem Cleanup
Crucial Step: Once you have identified and resolved the issue, remember to return to the Support Logs settings and set the logging level for com.vmware.vcops.platform.notification.webhook.WebhookSender back to INFO or remove the class configuration entirely. Leaving DEBUG logging enabled can lead to rapid disk consumption and potential performance degradation in the Analytics node.
Conclusion
Troubleshooting integrations requires looking beyond the surface. By dynamically adjusting log levels in VCF Operations, we can turn a “black box” failure into a solvable configuration error. Happy troubleshooting!